
.png)


(348 reviews)
AI Driven Data Analytics Career Track Program
৳৫,৮০০
ব্যাচ শুরু
শনিবার ৩১ অক্টোবর
৩১ অক্টোবর
লাইভ ক্লাস
রাত ৯:৩০- ১১:০০ (রবি,মঙ্গল)
সাপোর্ট ক্লাস


ক্লিক করে দেখে নিন কোর্সের ডেমো ক্লাস

Personal
একসাথে (Group)
৳৫,৮০০

ব্যাচ শুরু হতে সময় বাকি - 0d :0h :0m :0s
এই কোর্সে আপনি পাচ্ছেন:

৪ মাসের স্টাডি প্ল্যান
১৬ টি মডিউল
২৮ টি লাইভ ক্লাস
৬ টি রিয়েল লাইফ প্রজেক্ট
উইকলি ৩ দিন সাপোর্ট ক্লাস
৪ টি জব মার্কেট এবং ফ্রিল্যান্সিং গাইডলাইন ক্লাস
জব মার্কেট গাইডলাইন ও ফ্রিল্যান্সিং এর এ টু জেড নিয়ে লাইভ ক্লাস
এক্সক্লুসিভ জব প্লেসমেন্ট সাপোর্ট!
এসেসমেন্ট ও সার্টিফিকেট
কোর্স সম্পর্কে:
Excel, SQL, এবং Power BI ডেটা অ্যানালাইসিসে দক্ষতা অর্জন এখন আর কোনো রকেট সায়েন্স নয়, তবে সঠিক গাইডলাইন এবং প্র্যাকটিক্যাল নলেজ ছাড়া অনেকেই ডেটা অ্যানালিটিক্সের সম্ভাবনাকে পুরোপুরি কাজে লাগাতে পারছেন না। তাই, ওস্তাদ নিয়ে এলো “Data Analytics Job Ready Programme” - যেখানে একদম বেসিক থেকে অ্যাডভান্সড Excel, SQL, এবং Power BI পর্যন্ত শেখানো হবে।
এই লাইভ ব্যাচে যা থাকছে:
- Excel দিয়ে শুরু করে Power Query, Power Pivot এবং DAX পর্যন্ত ডেটা ক্লিনিং, মডেলিং এবং Business Dashboard তৈরির সবকিছু হাতে-কলমে শিখবেন। এরপর SQL দিয়ে ডেটা এক্সট্র্যাকশন ও অ্যানালাইসিস এবং Power BI দিয়ে প্রফেশনাল ভিজুয়ালাইজেশন ও রিপোর্ট পাবলিশিং শেখানো হবে।
- AI-এর যুগে এগিয়ে থাকতে Claude দিয়ে Excel ফর্মুলা লেখা এবং Power BI ড্যাশবোর্ড তৈরির মতো AI-Assisted Data Analytics-ও কভার করা হবে।- প্রতিটি সেকশন শেষে থাকছে Exam Week অ্যাসাইনমেন্ট ও লাইভ টেস্টের মাধ্যমে নিজের দক্ষতা যাচাই করার সুযোগ।
- ক্যারিয়ার গাইডলাইনে থাকছে Resume তৈরি, ইন্টারভিউ প্রস্তুতি, জব মার্কেট স্ট্র্যাটেজি এবং ফ্রিল্যান্সিং মার্কেটপ্লেসে সফল হওয়ার A to Z।
সহজ ভাষায় বলতে গেলে, জিরো থেকে একজন প্রফেশনাল Data Analyst হওয়ার জন্য যা যা প্রয়োজন, তার পূর্ণাঙ্গ রোডম্যাপ পাবেন এই কোর্সে।

কারিকুলাম

কোর্সে আপনি পাচ্ছেন

প্রজেক্টসমূহ

কোর্সটি যাদের জন্য

জব পেয়েছে যারা

রিভিউ

FAQ

পেমেন্ট
কারিকুলাম
কোর্সে আপনি পাচ্ছেন
প্রজেক্টসমূহ
কোর্সটি যাদের জন্য
জব পেয়েছে যারা
রিভিউ
FAQ
পেমেন্ট
কোর্স করার আগে ডেমো ক্লাস করে দেখুন
প্রত্যেকটা সেকশনের কান্ট্রির বেস্ট ইন্সট্রাক্টরদের লাইভ ক্লাস কেমন হয়, দেখে নিন
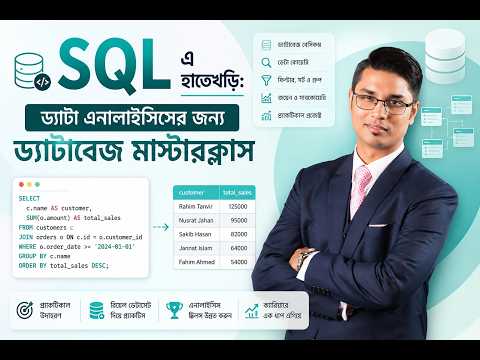

SQL এ হাতেখড়িঃ ড্যাটা এনালাইসিসের জন্য ড্যাটাবেজ মাস্টারক্লাস

Kazi Jubair Radin
Senior Business Analyst at ACI Logistics Limited
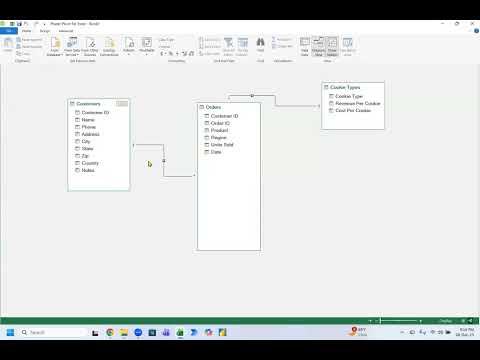
Using Measure in PowerPivot, Preparing dashboard using PowerPivot

Rashed Munshi
Corporate Power BI & Excel Trainer

একদম Scratch থেকে শুরু করে Excel Dashboard বিল্ডের Masterclass

Mir Masud Uz Zaman
Manager at Omera Petroleum Ltd. | Microsoft Office Specialist - Expert | NSDA Certified Trainer and Assessor

Claude দিয়ে বানাই একটা Marketing Analytics ড্যাশবোর্ড
Mir Masud Uz Zaman
Manager at Omera Petroleum Ltd. | Microsoft Office Specialist - Expert | NSDA Certified Trainer and Assessor
লাইভ ডেমো ক্লাস
কোর্সে জয়েনের আগে লাইভ ডেমো ক্লাস করে নিন।
Claude ইউজ করে চলেন বানাই একটা সেলস এক্সেল ড্যাশবোর্ড
২৪ অক্টোবর
রাত ১০:০০টা


১৫৬০ জন লাইভ ডেমো ক্লাসটি বুক করেছেন।
১৫৬০ জন লাইভ ডেমো ক্লাসটি বুক করেছেন।
কারিকুলাম
১৬ মডিউল
২৮ লাইভ ক্লাস
Deep Dive into Excel (Module 1-7)
ক্লাস নিবেনঃ

Mir Masud Uz Zaman
সপ্তাহ
১
Actionable Usage of Excel


2 live class
Live Class 1:
Introduction to Data Analytics | Component of a Data Analyst | Tools needed to be a Data Analyst | Why Data Analytics? | Scope of a Data Analyst | Introduction to Excel interface |
Cell formatting: Copy, Cut, and Paste in Excel | Cell Referencing (Relative vs Absolute Referencing) | Formatting Shortcuts | Flash Fill Tutorial
Live Class 2:
Advanced Excel Basics | Conditional Formatting | Data Structure: Sorting and Filtering | Customizing header and footer | Using Print Area | Fixing number of pages to be printed of whole sheet | Printing both sides | Printing in center of the page Using | Freezing Panes | Splitting windows
সপ্তাহ
৩
Complex Data Management : What If Analysis & Excel Pivot
2 live class
Live Class 1
What-if Analysis |Goal Seek | Data mapping to prepare a PivotTable | Various types of report layout (report in compact form, report in tabular form) | Customizing subtotal at any row label data and subtotal category | Changing PivotTable data source
Live Class 2
What-if Analysis Scenario Manager| Inserting a calculated field and calculated item | Grouping/ungrouping data by year, quarter, month, day | Sorting and filtering techniques in PivotTable data | Slicer in PivotTable (creating, changing, and formatting) | Make your PivotTable dynamic using slicer | Pivotby Function
সপ্তাহ
৫
Data Cleaning Wizards: Power Query
2 live class
Live Class 1
What Is Power Query | PowerQuery | Understanding table structure | Merge & Append Table
Live Class 2
Creating data model | Exploring PowerPivot | Unpivot Technique
সপ্তাহ
৭
Exam Week 1
Assignment
মডিউল ১ থেকে মডিউল ৬ পর্যন্ত যা যা আলোচনা হয়েছে, তার উপর ভিত্তি করে থাকবে একটি বড়সড় অ্যাসাইনমেন্ট। এটি আপনাকে আপনার শেখা বিষয়গুলো পুনর্বিবেচনা এবং বাস্তব জীবনের চ্যালেঞ্জ মোকাবিলার প্রস্তুতি নিতে সাহায্য করবে।Test
মডিউল ১ থেকে মডিউল ৬ পর্যন্ত শেখা বিষয়গুলোর উপর ভিত্তি করে একটি লাইভ টেস্ট হবে। এই টেস্টে আপনার দক্ষতা ঝালাই করার সুযোগ থাকবে।
সপ্তাহ
২
Excel Formula in Business Integration
2 live class
Live Class 1
Logical Functions | FILTER | IF() Condition and Expression of Logical Test | Using IF with AND & OR || AI In Excel | Text Function (Join & Split) |Carefulness of VLOOKUP Function
Live Class 2
Using GROUPBY | SUMIF, COUNTIF | Using SUMIFS, COUNTIFS,INDEX and MATCH function,Using AVERAGEIFS |AVERAGEIF
সপ্তাহ
৪
Power Pivot, Dax & Data Modelling
2 live class
Live Class 1
Understanding table structure | Understanding various relationships | Understanding primary & foreign key| Manage data model from multiple file | Dynamic Model
Live Class 2
Using Measure in PowerPivot | Preparing dashboard using PowerPivot |Manage data from multiple folders | Using few DAX functions in PowerPivot
সপ্তাহ
৬
Business Dashboard
2 live class
Live Class 1
Business Dashboard | Power Query| Power Pivot| Dax
Live Class 2
Business Dashboard | Power Query| Power Pivot| Dax
Understanding SQL (Module 8-9)
ক্লাস নিবেনঃ

Kazi Jubair Radin
সপ্তাহ
৮
SQL for Data Modeling and Visualization
2 live class
Live Class 1: Introduction to SQL and Data Models
Understanding SQL and Data Models | Basic SQL Syntax and Structure | SELECT Statement: Retrieving Data from Tables | Filtering Data with WHERE Clause | Sorting Data with ORDER BY Clause
Live Class 2: Data Models and Basic SQL Queries
Understanding Data Models | Using SQL for Data Extraction | Aggregating Data for Dashboards | Introduction to SQL Joins | Simple Grouping and Aggregation
সপ্তাহ
৯
Advanced SQL Queries for Data Analysis and Dashboards
2 live class
Live Class 1: Working with Joins and Subqueries in SQL
Joins in SQL | Subqueries: Introduction and Usage | Using Subqueries for Filtering Data | Working with Multiple Tables | Performance Considerations
Live Class 2: Aggregating and Visualizing Data for Dashboards
Advanced SQL Aggregation | Nested Queries for Complex Data Analysis | Data Aggregation for Dashboards | Using Subqueries and Nested Queries for Data Modeling | Query Optimization Techniques
PowerBI and Data Visualization (Module 10-13)
ক্লাস নিবেনঃ

Rashed Munshi
সপ্তাহ
১০
Power BI Data Intelligence Foundation
2 live class
Live Class 1: Power BI Professional: From Raw Data to Insight
Power BI ecosystem & workflow | Power BI Desktop interface, views, panes & ribbons | Connecting Excel/CSV and other common business data sources | Understanding tables, fields & data types | Import vs. basic connectivity concepts | Professional data-analysis workflow
Live Class 2: Data Preparation Mastery: Power Query & Smart Data Shaping
Power Query Editor fundamentals | Data profiling & quality checks | Filtering, sorting & replacing values | Handling missing values and duplicates | Merging & appending datasets | Pivoting & unpivoting | Datatype management | Basic data-model preparation
সপ্তাহ
১২
Power BI Executive Intelligence & Decision Excellence
2 live class
Live Class 1: Power BI in the AI Era: Automation, Collaboration & Business Decision-Making Dashboard
Power BI Service dashboard fundamentals | Sharing and collaboration | Basic access control and security concepts | Refresh concepts and report lifecycle | Q&A and natural-language interaction | Copilot in Power BI: prompts, summaries, insights and report assistance | AI-assisted narrative and insight generation | Identifying trends, anomalies and key business drivers | Responsible use and validation of AI-generated insights | From dashboard to data-driven decision-making
Live Class 2: Professional Power BI Reporting: From Dashboard to Decision
Building a complete professional report | Report-page structure and navigation | Advanced filtering & interactions | Drill-through and tooltip pages | Bookmarks and basic report navigation | Performance and usability considerations | Executive reporting standards | Introduction to Power BI Service | Publishing reports and dashboards | Workspace fundamentals | Sharing and collaboration | AI-powered Q&A and natural-language exploration
সপ্তাহ
১১
Power BI Insight & Performance Intelligence
2 live class
Live Class 1: Insightful Dashboard Design: Visual Analytics & Storytelling
Selecting the right visual for the business question | Bar, column, line, combo, table & matrix visuals | KPI cards and summary indicators | Formatting, themes, labels and titles | Slicers, filters & visual interactions | Drill-down & drill-through | Designing an executive-friendly dashboard | Principles of data storytelling and visual hierarchy
Live Class 2: DAX for Business Intelligence: From Calculation to KPI
Understanding DAX and its role in Power BI | Calculated columns vs. measures | SUM, AVERAGE, COUNT, DISTINCTCOUNT | CALCULATE and basic filter context | IF and conditional calculations | Basic time/intelligence concepts | Business KPIs and performance indicators | Creating reusable measures | Using AI/Copilot to assist with DAX creation and explanation | Validating AI-generated calculations
সপ্তাহ
১৩
Exam Week 2
Assignment
মডিউল ৮ থেকে মডিউল ১২ পর্যন্ত যা যা আলোচনা হয়েছে, তার উপর ভিত্তি করে থাকবে একটি বড়সড় অ্যাসাইনমেন্ট। এটি আপনাকে আপনার শেখা বিষয়গুলো পুনর্বিবেচনা এবং বাস্তব জীবনের চ্যালেঞ্জ মোকাবিলার প্রস্তুতি নিতে সাহায্য করবে।Test
মডিউল ৮ থেকে মডিউল ১২ পর্যন্ত শেখা বিষয়গুলোর উপর ভিত্তি করে একটি লাইভ টেস্ট হবে। এই টেস্টে আপনার দক্ষতা ঝালাই করার সুযোগ থাকবে।
কোর্সটি আপনারই জন্য

ইন্সট্রাক্টর

Mir Masud Uz Zaman
Manager-Omera Petroleum Ltd. | Microsoft Office Specialist - Expert | NSDA Certified Trainer and Assessor | Sales Professional



Kazi Jubair Radin
Senior Business Analyst at ACI Logistics Limited | Former Assistant Manager at Samsung Electronics | Former Sales Analyst at RANCON


.png)
Md. Nazmul Muneer
Microsoft Certified Trainer, Deputy Manager, Accounts & Finance at Beximco Pharmaceuticals Ltd

.png)

Sanjib Samadder
Operation Analyst at Caring | Former Data Analyst at Alegre Home Health Care | Former Deputy Director at Walton Hi-Tech Industries PLC | Former Business Analyst at Omera Petroleum Limited | Former Business Analyst at Samsung






Rashed Munshi
Corporate Power BI & Excel Trainer | Microsoft Certified Excel Trainer | Looker Studio Expert | SQL | Business Analyst | Sales Automation Specialist | Data Visualization Expert | Ex-GP | Business Analyst | Macro distribution | Business Strategy






Hedayet Ali
Business Analyst with Power BI Expert | Regional Sales Head at New Zealand Dairy Products (BD) Ltd. | Former Regional Manager (Responsible for Dhaka Regional Trade & Modern Trade of Bangladesh) at Golden Harvest Foods Limited | Former Regional Sales Manager at PepsiCo | Former Area Manager-Market operations at Robi Axiata Bangladesh Ltd. | Former Senior Territory Manager at Citycell

.png)
.png)
.png)
.png)
.png)
Mahjabin Siddika Oyshi
Teaching Assistant at Ostad | Research Assistant at SUST Research Center | B.Sc. Statistics, SUST | R Open-Source Contributor


Neamul Islam Fahim
Teaching Assistant at Ostad | Junior UI/UX Designer & Frontend Developer at Alxicorn


যেসব টুলস ও টেকনোলোজি শিখবেন

MS Excel
.png)
Power BI

SQL

ChatGPT
.png)
Claude
কী কী থাকতে হবে

ল্যাপটপ/ডেস্কটপ (মিনিমাম ৮ জিবি র্যাম)

ভালো ইন্টারনেট কানেকশন

মিনিমাম Core i3 প্রসেসর

২৫৬ জিবি এসএসডি

লেগে থাকার মানসিকতা
কোর্সে আপনি পাচ্ছেন

৪ মাসের স্টাডিপ্ল্যান

২৮ টি লাইভ ক্লাস

৬ টি রিয়েল লাইফ প্রজেক্ট

প্রোগ্রেস ট্র্যাকিং

উইকলি ৩ দিন সাপোর্ট ক্লাস

কমিউনিটি সাপোর্ট

লাইফটাইম এক্সেস

জব মার্কেট গাইডলাইন

ইন্টারভিউ হ্যান্ডবুক

সার্টিফিকেট
কোর্স শেষে পাচ্ছেন এক্সক্লুসিভ জব প্লেসমেন্ট সাপোর্ট!

যেসকল রিয়েল লাইফ প্রোজেক্ট করানো হবে
HR Analytics with Dashboard Creation at Power Pivot & Power Query


Business Analytics of FMCG Industry with Power BI Dashboard

Report Analysis with conditional formatting

Report Analysis with different conditional formatting

Report Analysis and dashboard creation with pivot table

Report Analysis and dashboard creation with SQL

কোর্সটি আপনারই জন্য
সাকসেসফুল হয়েছেন যারা
ফিডব্যাক
আমাদের লার্নারদের কাছে শুনুন
Overall, the Course Instructors are skilled and high-quality.
OM
Ovijit Majumdar (ব্যাচ ২১)

I have thoroughly enjoyed this course. The Course Instructors explain complex topics in a very clear and engaging manner. Furthermore, they are highly approachable and supportive whenever students have questions.
AF
Anamika Farzana Haque (ব্যাচ ২১)
This course is very useful for me. Specially the FILTER function.
MM
Md. Mehedi Hasan (ব্যাচ ১৯)
I have enjoyed the course thoroughly. All the tools and techniques we learned were helpful. A lot of the functions and tools are important and related to my work. So I am really thankful for this course and really happy with the Course Instructors. They are very friendly and cooperative.
SM
Siam Mim (ব্যাচ ১৯)
Detail-oriented Course Instructors. Love, and much respect.
AS
Abu Shayed (ব্যাচ ১৯)
Friendly, patient and supportive Course Instructors.
MM
Mehjabin Mosharuf (ব্যাচ ১৮)
The Excel training was excellent. Our Course Instructors explained every topic clearly and made learning easy and enjoyable. I must say they are some of the best instructors I have ever learned from. Thank you to the management for allowing us to learn from them.
TS
Tonu Saha (ব্যাচ ১৮)
I admire the support and knowledge of the Course Instructors.
SS
Saima Sultana Badhan (ব্যাচ ১৬)
The Course Instructors are very knowledgeable and efficient to teach, and friendly and supportive to learn from.
JN
Jannatun Nesa (ব্যাচ ২১)
The Course Instructors are very friendly. Their communication and teaching skills are excellent. I especially enjoyed the way they explained topics with fun and practical examples, which made the lessons easy to understand and very engaging.
SM
Shakib Munshi (ব্যাচ ২০)
The Course Instructors explain the topics in a very easy way and with detailed examples.
SC
Shovo Chandra Das (ব্যাচ ১৯)
The Course Instructors are very approachable, supportive, and helpful. The lessons are explained clearly, and the course is engaging and easy to understand. I am very satisfied with the Course Instructors' teaching style and guidance.
KM
Kaniz Masuma (ব্যাচ ১৯)
The Course Instructors are very professional and supportive to the learners.
AC
Apurbo Chowdhury (ব্যাচ ১৯)
The Course Instructors explained the topics clearly and effectively.
MA
Md. Abu Zahidul Murad (ব্যাচ ১৯)
The Course Instructors were good, informative and straightforward, which is highly appreciated.
TO
Tanjid Osman (ব্যাচ ১৮)
The Course Instructors are amazing. Their explanation and topic-by-topic coverage, spending good time to ensure we understand 100%, help me remember every topic in detail.
BM
Bayzid Mostak (ব্যাচ ১৮)
The Course Instructors are good at communicating & supporting.
TK
Tapash Kanti Bhattacharjee (ব্যাচ ১৮)
The Course Instructors teach clearly and make learning genuinely easier.
S
Shukhy (ব্যাচ ১৭)
The Course Instructors explain very well and prioritise student problems and questions.
KD
Kaushik Dey Joy (ব্যাচ ১৬)
Well done so far. I'm new to this, so starting from the basics was great.
YN
Yasin Nur Siddiqui (ব্যাচ ২০)
It was a very useful course for me. I already had a basic understanding of all the sections covered, but this course helped me gain deeper knowledge and introduced me to several advanced features. Overall, it enhanced my understanding of the topics and improved my practical skills.
AA
Asif Ahmed Hridoy (ব্যাচ ২০)
Very good Course Instructors with excellent teaching skills. They explain clearly, engage students effectively, and create a positive learning environment.
AS
A.S.M. Morsalinul Islam (ব্যাচ ১৯)
The course is always excellent. The Course Instructors are wonderful and always make complicated topics very easy so that students can easily understand. They always answer every student's queries. I love to attend this course.
R
Rafika (ব্যাচ ১৯)
The way the Course Instructors conducted the Power BI part of the course was excellent. With such a clear and effective teaching style, it becomes much easier to understand and learn new concepts.
MK
Mostafa Kamal (ব্যাচ ১৯)
Extremely well-articulated course.
FZ
Farhana Zinia (ব্যাচ ১৮)
Very friendly and amazing Course Instructors. Liked how they put all their efforts to make a concept understandable.
ন
নিসর্গ (ব্যাচ ১৭)
The Course Instructors explain everything clearly and are very helpful.
SH
Shakil Hashda (ব্যাচ ২১)
The Course Instructors are very friendly and helpful. It's a nice experience to attend this course. They always try to help us understand tough topics very easily, and their professionalism is excellent.
MK
Masuma Khatun (ব্যাচ ২১)
The Course Instructors are good, they keep the course active and sound. I enjoyed the course!
T
Taiser (ব্যাচ ২০)
The Course Instructors are excellent. They explain concepts clearly, are patient and supportive, and create a positive learning environment. I really enjoyed learning from them.
IJ
Ishrat Jahan (ব্যাচ ১৯)
The Course Instructors explain complex Excel formulas clearly and use great real-world data examples.
SB
Shushuvon Bhattacharjee (ব্যাচ ১৯)
The Course Instructors are wonderful. They made my day with excellent detailing of pivot tables.
SS
Sharmin Shobnom Joya (ব্যাচ ১৯)
The Course Instructors were very humble and very supportive.
KR
Khaleda Rahman Mim (ব্যাচ ১৮)
The Course Instructors shared the basic information regarding the course in an orderly manner.
IM
Irfan Mohammad Al Kamil (ব্যাচ ১৮)
The Course Instructors are good at explaining things clearly.
SA
Sanjida Akther (ব্যাচ ১৮)
The Course Instructors are very much interactive and friendly, with kindness and wisdom.
DD
Dr. Deepanjan Bhattacharya (ব্যাচ ১৭)
Course Instructors onk balo bujai. Ei course kore sotti onk kicu sika jai.
RI
Rifatul Islam Tanvir (ব্যাচ ১৭)
The Course Instructors explain the topics very well and make an effort to ensure each point is clear by repeating key concepts when needed. Overall, their presentation is engaging and effective.
FA
Fahmida Azad (ব্যাচ ১৬)
Subject matter expert and enthusiastic Course Instructors.
D
Dabasish (ব্যাচ ২০)
খুবই সুন্দর ও সহজভাবে বুঝিয়েছে।
IS
Ifat Sheikh (ব্যাচ ২০)
I didn't expect to learn in such a way. It's really easy to understand from the basics. Hope I can learn and remember the learnings as well.
SH
Samia Husna (ব্যাচ ১৯)
Strong voice, smartly handling students. That's how the Course Instructors run this course.
MM
Md. Mashrafi (ব্যাচ ১৯)
Really enjoyed the informal approach of the Course Instructors.
MK
Mostafa Kamal Rana (ব্যাচ ১৮)
Supportive, polite and respectful Course Instructors.
MB
Maruf Billah (ব্যাচ ১৮)
Blessed to have them. Well organised, dedicated, supportive and easygoing Course Instructors.
SD
Siddertha Das (ব্যাচ ১৭)
The Course Instructors were really well organized in their teaching approach. I liked the way the course started. Hope to get the most out of this.
SB
Sunanda Biswas (ব্যাচ ২১)
The Course Instructors are very friendly, so the course wasn't boring and the learning outcome was excellent.
MT
Mahjabeen Tabassum (ব্যাচ ২০)
The Course Instructors were excellent and made the course engaging and interactive. They explained concepts clearly and had a great ability to make even challenging or boring topics interesting and easy to understand.
SR
Sanjida Ribanoor Khan (ব্যাচ ২০)
The Course Instructors were very helpful and clearly explained every topic.
SH
Sabbir Hossain Shaon (ব্যাচ ১৯)
The Course Instructors explained the topics clearly with practical examples. The sessions were interactive, and all questions were answered patiently. Overall, it was a very informative and engaging training experience.
MS
Md. Shahadat Hossain Rumon (ব্যাচ ১৯)
The Course Instructors are approachable and knowledgeable towards the subject matter.
MA
Mohammad Abdur Rab (ব্যাচ ১৯)
The Course Instructors were so focused on delivering the main gist. It saves time and energy of both students and instructors.
ZZ
Zinat Zaman (ব্যাচ ১৮)
The Course Instructors were very spontaneous and responsive in the course.
TK
Torun Kumar Saha Tirtho (ব্যাচ ১৮)
The Course Instructors are excellent trainers with strong expertise in AI-driven data analysis and Excel. Their teaching style is clear, practical, and easy to follow. They are good listeners, always responsive to questions, and very helpful in resolving problems. The course was well-structured and enriched with real-world examples, making complex concepts easier to understand. I highly recommend this training to anyone looking to enhance their data analysis skills.
KA
Khondoker Azmin Ahmed (ব্যাচ ১৮)
The Course Instructors conducted the course nicely. It's outstanding and I may be able to learn more from them.
ZR
Zahidur Rahman Khan (ব্যাচ ১৭)
The Course Instructors explained all the topics very well with clear communication and a very engaging presentation style. Their professionalism, their friendly approach to the students and the excellent quality of the videos made the learning experience truly outstanding.
MR
Masud Rana (ব্যাচ ১৭)
The Course Instructors are well qualified and dedicated. They have enough knowledge to teach us.
TM
Tareq Mohammad Saifullah (ব্যাচ ১৬)
Great teaching style and approachable personality of the Course Instructors.
SH
Sajjad Hossain (ব্যাচ ১৯)
The teaching process of the Course Instructors is excellent. Specially relating things with the real world makes it more understandable to me.
MM
Md. Mustafizur Rahman (ব্যাচ ১৯)
Learned new lessons throughout the course.
MS
Marceline Swarna Modhu (ব্যাচ ১৯)
The course was very interactive and the Course Instructors give explanations very thoroughly and in detail.
AS
Abdus Samad Sadman (ব্যাচ ১৯)
Clear and precise communication. I especially like the way the Course Instructors handled disrupters.
ZH
Zayed Hasan Ryan (ব্যাচ ১৮)
I learned a few new things. That helps me in my professional career.
MW
Md. Walid Hossain Khan (ব্যাচ ১৮)
Appreciate the way the Course Instructors communicate & their politeness.
SK
Sheikh Khalid Hussain (ব্যাচ ১৭)
The Course Instructors are very supportive and friendly, and the knowledge they give is very easy to understand.
MH
Md Habibul Alam (ব্যাচ ২১)
The Course Instructors were very good and explained everything in a nice way. I really enjoyed the course.
AI
Asraful Islam Jony (ব্যাচ ২০)
The Course Instructors were very good. They made the concepts easy and clear for me.
TI
Tondra Islam (ব্যাচ ২০)
The Course Instructors are knowledgeable, friendly, and make the course engaging.
AB
Abu Bakkar Osman (ব্যাচ ১৯)
The Course Instructors are well aware of the contents and well prepared, and they make sure the course is interactive.
TN
Tasnia Nur Maahi (ব্যাচ ১৯)
The Course Instructors are simply awesome and learning things isn't monotonous.
BD
Bishway Datta (ব্যাচ ১৯)
The Course Instructors were very helpful and supportive. They explained every question that was asked very beautifully. They are very good at explaining complex matters.
A
Atanu (ব্যাচ ১৮)
The Course Instructors try to teach us Excel grammatically. That's very effective.
SA
Showket Ahamed (ব্যাচ ১৮)
The Course Instructors are very helpful and explain the topics very well. They will not finish a session until everyone has finished asking questions. They always encourage you that if you try, you too can do it.
MN
Md. Nazmul Islam (ব্যাচ ১৮)
The Course Instructors were very friendly and kind enough to share good ways of learning.
TA
Tashrif Ahmed Rad (ব্যাচ ১৭)
The Course Instructors show practical examples, which is very good.
RI
Rafijul Islam (ব্যাচ ১৭)
Our Course Instructors are top notch and also good listeners, no doubt about it. They always deliver relevant information with different examples.
RR
Rafsan Rabbi (ব্যাচ ১৮)
সার্টিফিকেট
কোর্স শেষে পেয়ে যান শেয়ারেবল কোর্স কমপ্লিশন এবং এসেসমেন্ট সার্টিফিকেট
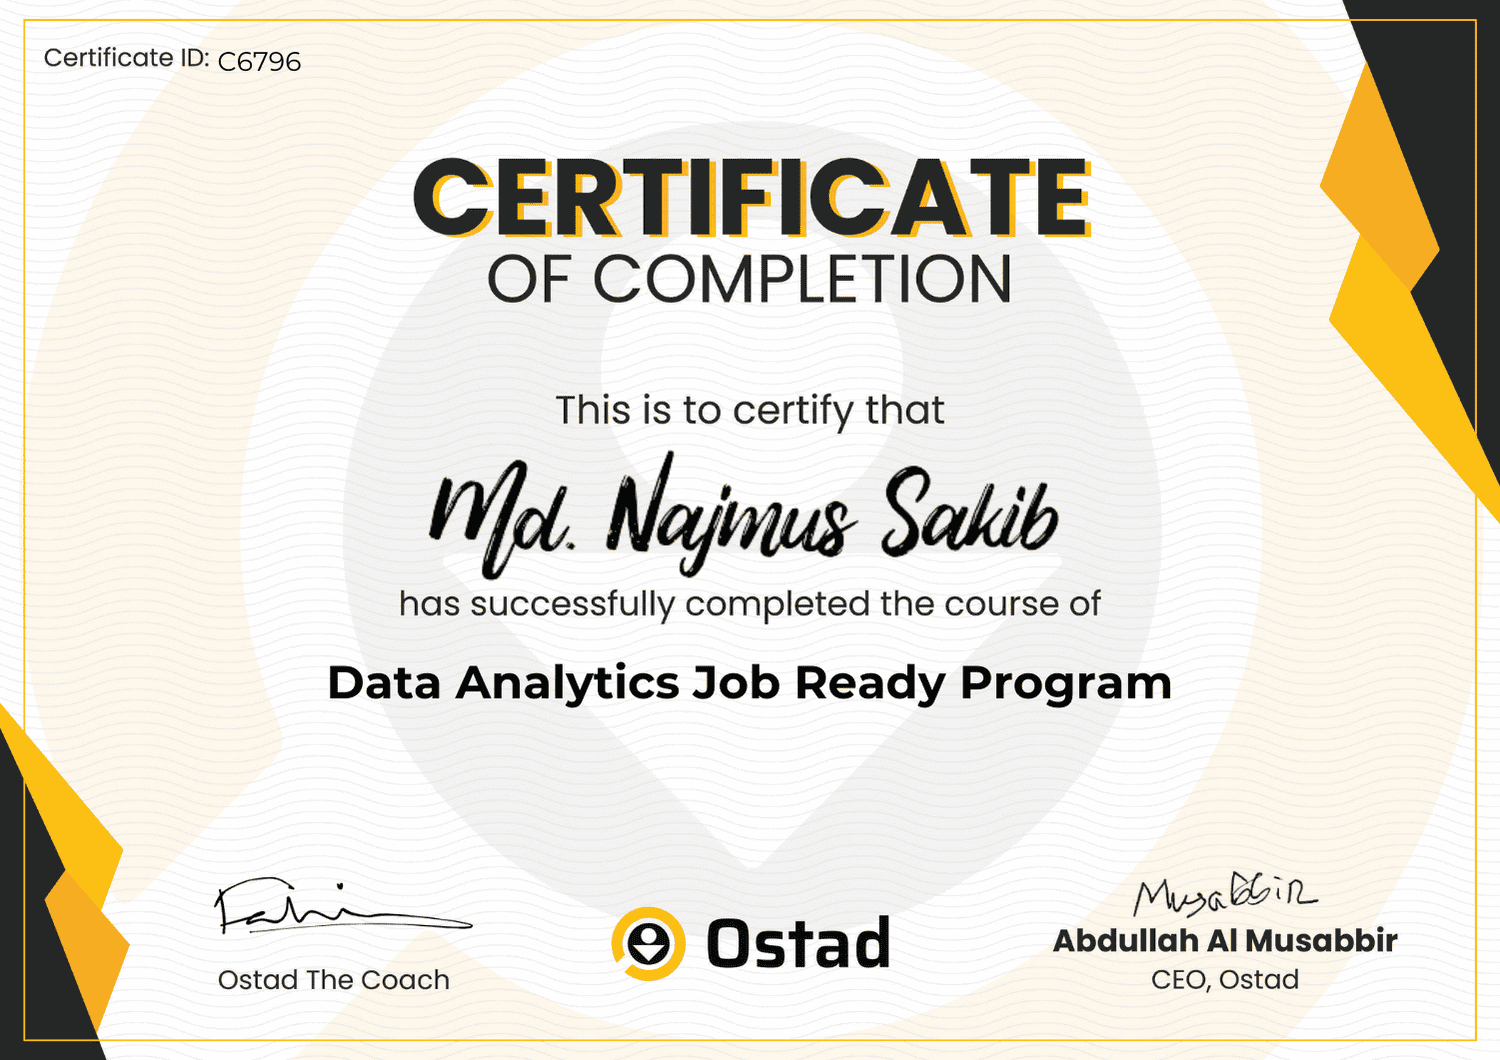
কোর্স কমপ্লিট করে পেয়ে যান শেয়ারেবল কোর্স কমপ্লিশন সার্টিফিকেট
কোর্সে আপনার এসেসমেন্টের রেজাল্টের ওপর পেয়ে যান এসেসমেন্ট সার্টিফিকেট
.jpg)
প্রায়ই জিজ্ঞেস করা প্রশ্ন

কিভাবে পেমেন্ট করবো?
1. পেমেন্ট মেথড কি কি?
 আপনি সরাসরি ওস্তাদের পেমেন্ট গেইটওয়ের মাধ্যমে Bkash, Nagad, Rocket, Visa, Mastercard, Debit and Credit কার্ড দিয়ে পেমেন্ট করতে পারবেন।
2. আমি কি যেকোনো ডিভাইস দিয়ে পেমেন্ট করতে পারবো?
জ্বী, আপনি ফোন, পিসি কিংবা ল্যাপটপ যেকোনো ডিভাইস দিয়ে পেমেন্ট করতে পারবেন।3. পেমেন্ট প্রসেস কি?
পেমেন্ট করার জন্য প্রথমে ব্যাচে ভর্তি হোন বাটনে ক্লিক করুন। এরপর পেমেন্ট পেইজ থেকে পেমেন্ট মেথড সিলেক্ট করে পেমেন্ট করুন বাটনে ক্লিক করুন এবং পেমেন্ট সম্পন্ন করুন।4. ডিসকাউন্ট কিভাবে পাবো?
আপনি ব্যাচে ভর্তি হওয়ার আগে এভেইলেবল প্রোমো কোড বসিয়ে এক্সপেক্টেড ডিসকাউন্ট পেতে পারেন।5. পেমেন্ট কনফার্মেশন কিভাবে পাবো?
পেমেন্ট প্রসেস শেষ হলে আপনার কাছে একটি মেসেজ আসবে এবং আপনার ড্যাশবোর্ডে আপনার জয়েন করা ব্যাচটি দেখাবে। আপনার স্টাডি প্লান অনুযায়ী কোর্স শুরু করে দিতে পারবেন।6. আমার লেনদেনের হিসাব থাকবে কি?
আপনার ড্যাশবোর্ডে আপনি প্রোফাইল থেকে ট্রাঞ্জেকশন ট্যাবে ক্লিক করে লেনদেন দেখতে পারবেন।
জয়েন করুন আমাদের ফেসবুক গ্রুপে


৩,৯০০ জন মেম্বার
Data Analytics Community
ক্যারিয়ার কাউন্সিলরের সাথে কথা বলুন

*সকাল ১০ টা থেকে রাত ১০টা পর্যন্ত
প্রোমো কোড UTSHOB ৪০% ডিসকাউন্ট, আর বাকি ২ দিন !