


(348 reviews)
AI Driven Data Analytics Career Track Program
৳5,800
ব্যাচ শুরু
Wednesday 29 July
29 July
Live Class
09:30 PM- 11:00 PM (Monday,Wednesday)
সাপোর্ট ক্লাস
রাত ০৯:০০ - ১০:০০ | (মঙ্গলবার, শুক্রবার, শনিবার)

কোর্স সম্পর্কে:
Excel, SQL, এবং Power BI ডেটা অ্যানালাইসিসে দক্ষতা অর্জন এখন আর কোনো রকেট সায়েন্স নয়, তবে সঠিক গাইডলাইন এবং প্র্যাকটিক্যাল নলেজ ছাড়া অনেকেই ডেটা অ্যানালিটিক্সের সম্ভাবনাকে পুরোপুরি কাজে লাগাতে পারছেন না। তাই, ওস্তাদ নিয়ে এলো “Data Analytics Job Ready Programme” - যেখানে একদম বেসিক থেকে অ্যাডভান্সড Excel, SQL, এবং Power BI পর্যন্ত শেখানো হবে।
এই লাইভ ব্যাচে যা থাকছে:
- Excel দিয়ে শুরু করে Power Query, Power Pivot এবং DAX পর্যন্ত ডেটা ক্লিনিং, মডেলিং এবং Business Dashboard তৈরির সবকিছু হাতে-কলমে শিখবেন। এরপর SQL দিয়ে ডেটা এক্সট্র্যাকশন ও অ্যানালাইসিস এবং Power BI দিয়ে প্রফেশনাল ভিজুয়ালাইজেশন ও রিপোর্ট পাবলিশিং শেখানো হবে।
- AI-এর যুগে এগিয়ে থাকতে Claude দিয়ে Excel ফর্মুলা লেখা এবং Power BI ড্যাশবোর্ড তৈরির মতো AI-Assisted Data Analytics-ও কভার করা হবে।- প্রতিটি সেকশন শেষে থাকছে Exam Week অ্যাসাইনমেন্ট ও লাইভ টেস্টের মাধ্যমে নিজের দক্ষতা যাচাই করার সুযোগ।
- ক্যারিয়ার গাইডলাইনে থাকছে Resume তৈরি, ইন্টারভিউ প্রস্তুতি, জব মার্কেট স্ট্র্যাটেজি এবং ফ্রিল্যান্সিং মার্কেটপ্লেসে সফল হওয়ার A to Z।
সহজ ভাষায় বলতে গেলে, জিরো থেকে একজন প্রফেশনাল Data Analyst হওয়ার জন্য যা যা প্রয়োজন, তার পূর্ণাঙ্গ রোডম্যাপ পাবেন এই কোর্সে।


Curriculum

কোর্সে আপনি পাচ্ছেন

প্রজেক্টসমুহ

কোর্সটি যাদের জন্য

জব পেয়েছে যারা

রিভিউ

FAQ

পেমেন্ট
Curriculum
কোর্সে আপনি পাচ্ছেন
প্রজেক্টসমুহ
কোর্সটি যাদের জন্য
জব পেয়েছে যারা
রিভিউ
FAQ
পেমেন্ট
Know Details about Course
To learn more about course, watch videos below
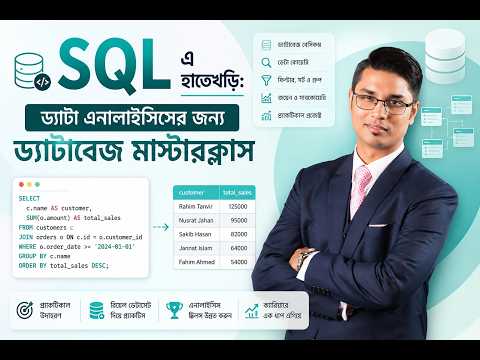

SQL এ হাতেখড়িঃ ড্যাটা এনালাইসিসের জন্য ড্যাটাবেজ মাস্টারক্লাস

Kazi Jubair Radin
Senior Business Analyst at ACI Logistics Limited
Overview of Power BI and its ecosystem Installing and setting up Power BI

Md. Nazmul Muneer
Deputy Manager, Accounts & Finance at Beximco Pharmaceuticals Ltd
Introduction to Power Query Editor Data transformation basics filtering
Md. Nazmul Muneer
Deputy Manager, Accounts & Finance at Beximco Pharmaceuticals Ltd
Using Measure in PowerPivot, Preparing dashboard using PowerPivot

Rashed Munshi
Corporate Power BI & Excel Trainer

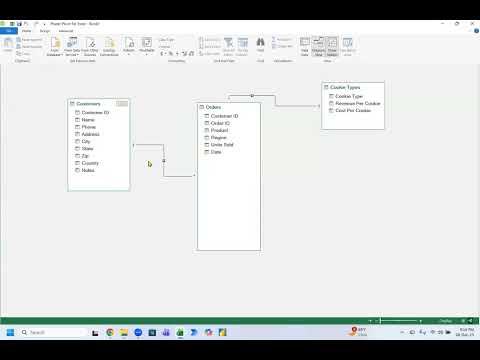
একদম Scratch থেকে শুরু করে Excel Dashboard বিল্ডের Masterclass

Mir Masud Uz Zaman
Manager at Omera Petroleum Ltd. | Microsoft Office Specialist - Expert | NSDA Certified Trainer and Assessor
লাইভ ডেমো ক্লাস
কোর্সে জয়েনের আগে লাইভ ডেমো ক্লাস করে নিন।
Claude এর সাথে এক্সেল: চলেন বানাই একটা Finance ড্যাশবোর্ড
13 July
09:00 PM


১৫৬০ জন লাইভ ডেমো ক্লাসটি বুক করেছেন।
১৫৬০ জন লাইভ ডেমো ক্লাসটি বুক করেছেন।
Curriculum
16 Module
28 Live Class
Deep Dive into Excel (Module 1-7)
Teacher:

Mir Masud Uz Zaman
Week
1
Actionable Usage of Excel
2 live class
1 Quiz
1 Assignment
Live Class 1:
Introduction to Data Analytics | Component of a Data Analyst | Tools needed to be a Data Analyst | Why Data Analytics? | Scope of a Data Analyst | Introduction to Excel interface |
Cell formatting: Copy, Cut, and Paste in Excel | Cell Referencing (Relative vs Absolute Referencing) | Formatting Shortcuts | Flash Fill Tutorial
Live Class 2:
Advanced Excel Basics | Conditional Formatting | Data Structure: Sorting and Filtering | Customizing header and footer | Using Print Area | Fixing number of pages to be printed of whole sheet | Printing both sides | Printing in center of the page Using | Freezing Panes | Splitting windows
Week
3
Complex Data Management : What If Analysis & Excel Pivot
2 live class
Live Class 1
What-if Analysis |Goal Seek | Data mapping to prepare a PivotTable | Various types of report layout (report in compact form, report in tabular form) | Customizing subtotal at any row label data and subtotal category | Changing PivotTable data source
Live Class 2
What-if Analysis Scenario Manager| Inserting a calculated field and calculated item | Grouping/ungrouping data by year, quarter, month, day | Sorting and filtering techniques in PivotTable data | Slicer in PivotTable (creating, changing, and formatting) | Make your PivotTable dynamic using slicer | Pivotby Function
Week
5
Data Cleaning Wizards: Power Query
2 live class
Live Class 1
What Is Power Query | PowerQuery | Understanding table structure | Merge & Append Table
Live Class 2
Creating data model | Exploring PowerPivot | Unpivot Technique
Week
7
Exam Week 1
1 Test
Assignment
মডিউল ১ থেকে মডিউল ৬ পর্যন্ত যা যা আলোচনা হয়েছে, তার উপর ভিত্তি করে থাকবে একটি বড়সড় অ্যাসাইনমেন্ট। এটি আপনাকে আপনার শেখা বিষয়গুলো পুনর্বিবেচনা এবং বাস্তব জীবনের চ্যালেঞ্জ মোকাবিলার প্রস্তুতি নিতে সাহায্য করবে।Test
মডিউল ১ থেকে মডিউল ৬ পর্যন্ত শেখা বিষয়গুলোর উপর ভিত্তি করে একটি লাইভ টেস্ট হবে। এই টেস্টে আপনার দক্ষতা ঝালাই করার সুযোগ থাকবে।
Week
2
Excel Formula in Business Integration
2 live class
1 Quiz
1 Assignment
Live Class 1
Logical Functions | FILTER | IF() Condition and Expression of Logical Test | Using IF with AND & OR || AI In Excel | Text Function (Join & Split) |Carefulness of VLOOKUP Function
Live Class 2
Using GROUPBY | SUMIF, COUNTIF | Using SUMIFS, COUNTIFS,INDEX and MATCH function,Using AVERAGEIFS |AVERAGEIF
Week
4
Power Pivot, Dax & Data Modelling
2 live class
Live Class 1
Understanding table structure | Understanding various relationships | Understanding primary & foreign key| Manage data model from multiple file | Dynamic Model
Live Class 2
Using Measure in PowerPivot | Preparing dashboard using PowerPivot |Manage data from multiple folders | Using few DAX functions in PowerPivot
Week
6
Business Dashboard
2 live class
Live Class 1
Business Dashboard | Power Query| Power Pivot| Dax
Live Class 2
Business Dashboard | Power Query| Power Pivot| Dax
Understanding SQL (Module 8-9)
Teacher:

Kazi Jubair Radin
Week
8
SQL for Data Modeling and Visualization
2 live class
Live Class 1: Introduction to SQL and Data Models
Understanding SQL and Data Models | Basic SQL Syntax and Structure | SELECT Statement: Retrieving Data from Tables | Filtering Data with WHERE Clause | Sorting Data with ORDER BY Clause
Live Class 2: Data Models and Basic SQL Queries
Understanding Data Models | Using SQL for Data Extraction | Aggregating Data for Dashboards | Introduction to SQL Joins | Simple Grouping and Aggregation
Week
9
Advanced SQL Queries for Data Analysis and Dashboards
2 live class
Live Class 1: Working with Joins and Subqueries in SQL
Joins in SQL | Subqueries: Introduction and Usage | Using Subqueries for Filtering Data | Working with Multiple Tables | Performance Considerations
Live Class 2: Aggregating and Visualizing Data for Dashboards
Advanced SQL Aggregation | Nested Queries for Complex Data Analysis | Data Aggregation for Dashboards | Using Subqueries and Nested Queries for Data Modeling | Query Optimization Techniques
PowerBI and Data Visualization (Module 10-13)
Teacher:

Md. Nazmul Muneer
Week
10
Power BI Essentials: Setup, Data Transformation & Cleaning
2 live class
Live Class 1
Overview of Power BI and its ecosystem | Installing and setting up Power BI Desktop | Power BI interface basics: panes, ribbons, and views | Overview of data sources compatible with Power BI | Hands-on Activity: Connecting to a simple dataset and importing data
Live Class 2
Introduction to Power Query Editor | Data transformation basics: filtering, merging, and appending tables | Data cleaning techniques: handling missing values, removing duplicates | Data Modeling | Basic data shaping: pivoting and unpivoting data | Hands-on Activity: Using Power Query to clean and transform raw data
Week
12
Power BI Report Publishing and Sharing
2 live class
Live Class 1
Creating and formatting a complete Power BI report | Introduction to Power BI Service: publishing and sharing reports | Setting up report access and security basics
Live Class 2
Basics of creating dashboards in Power BI Service | Hands-on Activity: Publishing a report to Power BI Service and sharing it
Week
11
Data Visualization and DAX Basics
2 live class
Live Class 1
Overview of visualization types: bar, line, pie charts, tables, etc. | Choosing the right visualization for data types | Formatting visuals: color, labels, titles, and interactions | Introduction to slicers, filters, and drill-throughs | Hands-on Activity: Building a simple dashboard with basic visuals
Live Class 2
Basics of DAX and its purpose in Power BI | Creating calculated columns and measures | Common functions: SUM, AVERAGE, COUNT, and basic conditional logic | Using DAX for aggregations and simple calculations | Hands-on Activity: Creating measures and calculated columns in a sample dataset
Week
13
Exam Week 2
Assignment
মডিউল ৮ থেকে মডিউল ১১ পর্যন্ত যা যা আলোচনা হয়েছে, তার উপর ভিত্তি করে থাকবে একটি বড়সড় অ্যাসাইনমেন্ট। এটি আপনাকে আপনার শেখা বিষয়গুলো পুনর্বিবেচনা এবং বাস্তব জীবনের চ্যালেঞ্জ মোকাবিলার প্রস্তুতি নিতে সাহায্য করবে।Test
মডিউল ৮ থেকে মডিউল ১১ পর্যন্ত শেখা বিষয়গুলোর উপর ভিত্তি করে একটি লাইভ টেস্ট হবে। এই টেস্টে আপনার দক্ষতা ঝালাই করার সুযোগ থাকবে।
কোর্সটি আপনারই জন্য

Instructor

Mir Masud Uz Zaman
Manager-Omera Petroleum Ltd. | Microsoft Office Specialist - Expert | NSDA Certified Trainer and Assessor | Sales Professional


Kazi Jubair Radin
Senior Business Analyst at ACI Logistics Limited | Former Assistant Manager at Samsung Electronics | Former Sales Analyst at RANCON
.png)
Md. Nazmul Muneer
Microsoft Certified Trainer, Deputy Manager, Accounts & Finance at Beximco Pharmaceuticals Ltd
.png)

Sanjib Samadder
Operation Analyst at Caring | Former Data Analyst at Alegre Home Health Care | Former Deputy Director at Walton Hi-Tech Industries PLC | Former Business Analyst at Omera Petroleum Limited | Former Business Analyst at Samsung


Rashed Munshi
Corporate Power BI & Excel Trainer | Microsoft Certified Excel Trainer | Looker Studio Expert | SQL | Business Analyst | Sales Automation Specialist | Data Visualization Expert | Ex-GP | Business Analyst | Macro distribution | Business Strategy


Hedayet Ali
Business Analyst with Power BI Expert | Regional Sales Head at New Zealand Dairy Products (BD) Ltd. | Former Regional Manager (Responsible for Dhaka Regional Trade & Modern Trade of Bangladesh) at Golden Harvest Foods Limited | Former Regional Sales Manager at PepsiCo | Former Area Manager-Market operations at Robi Axiata Bangladesh Ltd. | Former Senior Territory Manager at Citycell

.png)
.png)
.png)
.png)
.png)
Mahjabin Siddika Oyshi
Research Assistant (Remote) — Data Analyst at Q1 Edit | Former Data Scientist (Internship) at Software Intelligence


Neamul Islam Fahim
Teaching Assistant at Ostad | Junior UI/UX Designer & Frontend Developer at Alxicorn


যেসব ট্যুলস ও টেকনোলোজি শিখবেন
MS Excel
.png)
Power BI
SQL

ChatGPT
.png)
Claude
কী কী থাকতে হবে

ল্যাপটপ/ডেস্কটপ (মিনিমাম ৮ জিবি র্যাম)

ভালো ইন্টারনেট কানেকশন

মিনিমাম Core i3 প্রসেসর

২৫৬ জিবি এসএসডি

লেগে থাকার মানসিকতা
কোর্সে আপনি পাচ্ছেন

৪ মাসের স্টাডিপ্ল্যান

২৮ টি লাইভ ক্লাস

৬ টি রিয়েল লাইফ প্রজেক্ট

প্রোগ্রেস ট্র্যাকিং

উইকলি ৩ দিন সাপোর্ট ক্লাস

কমিউনিটি সাপোর্ট

লাইফটাইম এক্সেস

জব মার্কেট গাইডলাইন

ইন্টারভিউ হ্যান্ডবুক

সার্টিফিকেট
যেসকল রিয়েল লাইফ প্রোজেক্ট করানো হবে
HR Analytics with Dashboard Creation at Power Pivot & Power Query

Business Analytics of FMCG Industry with Power BI Dashboard

Report Analysis with conditional formatting

Report Analysis with different conditional formatting

Report Analysis and dashboard creation with pivot table

Report Analysis and dashboard creation with SQL

কোর্স শেষে পাচ্ছেন এক্সক্লুসিভ জব প্লেসমেন্ট সাপোর্ট!

কোর্সটি আপনারই জন্য
সাকসেসফুল হয়েছেন যারা
Feedback
Hear From Our Learner
আমি ওস্তাদের Data Analytics- ৮ম ব্যাচে ছিলাম। ৪ টা মডিউল রেগুলার ছিলাম কিন্তু পরে ব্যস্ততার কারণে পারিনি। তারপর আবার এই গ্রুপের সাথে কন্টিনিউ করি। ওস্তাদ তাদের কোর্সের ব্যাপারে আন্তরিক। তারা আপনাকে একটা ক্লাস মিস করতে দেবেনা যতক্ষণ না পর্যন্ত আপনি মিস করছেন। সবসময় রিমাইন্ডার নোটিসের মাধ্যমে সব আপডেট টাইমলি পেয়ে যাবেন। আর ইনস্ট্রাক্টর খুব ভালো খুব আন্তরিক। এরকম না হলে আমি আবার এই গ্রুপের সাথে আসতাম না। তাই এ ব্যাপারে চিন্তা করবেন না। চিন্তার বিষয়টা হলো পুরা কোর্স এ কনসিসটেন্সি প্রেজেন্ট থাকতে পারবেন কিনা এমনকি এসাইনমেন্ট গুলো করতে পারবেন কিনা। কারণ ওদের পক্ষ থেকে ওরা চেষ্টা কোন কমতি রাখবে না। চিন্তার বিষয় হলো আমার নিজেকে নিয়ে।
AI
Ashraful Islam

ব্যাচ ৫ (গ্র্যাজুয়েট) - আমি ফেরদৌস আলম। প্রথমেই ওস্তাদের পুরো টিমকেই আমি থ্যাঙ্কিউ দিতে চাই- অনেক ভালো একটা প্ল্যাটফর্ম করেছেন। আমরা যারা রিমোট এরিয়াতে থাকি, সারাদিন জব করার পর এরকম লার্নিং এর একটা ভালো অপর্চুনিটি করে দিয়েছেন। অনেক কিছু শেখার একটা ভালো পরিবেশ করে দিয়েছেন। প্রথম দিক থেকেই আমি একটিভ ছিলাম। অনেক কিছুই শিখেছি। আমার প্র্যাক্টিকাল লাইফে, জব লাইফে, প্রফেশনাল লাইফে ইমপ্লেমেন্ট করার চেষ্টা করতেছি। ইন্সট্রাক্টর যারা আছেন, প্রত্যেকজন হাইলি স্কিলফুল। এটা আমাদের জন্য বিরাট একটা পাওয়া। তাদের পোর্টফোলিওটা অনেক হাই লেভেলের। ওনাদের প্রত্যেকটা মিনিটের ভ্যালু আছে আলাদা। ওটা থেকে অনেকখানি সময় তাঁরা আমাদেরকে দিয়েছেন, আসলেই অনেক থ্যাংকিউ। এবং এটাও প্রতিশ্রুতি দিয়েছেন, ভবিষ্যতেও কখনো কোন হেল্প লাগলে, আমাদেরকে করবেন।
FA
Ferdous Alam
ব্যাচ ৬ রানিং - ইনস্ট্রাক্টররা খুবই হেল্পফুল এবং বিষয়টি পরিষ্কারভাবে বুঝানোর জন্য যথাসাধ্য চেষ্টা করেন।
UK
Ummy Kasfa
Batch 7 running - The instructors are very supportive and always try to connect with us.
AR
Ankita Rahman Purba
Batch 15 running - Grateful to have a data analyst instructor who makes numbers feel simple and learning feel exciting. A friendly mentor makes the journey powerful!.
TT
Tanvir Tasnim Minar
Batch 15 running - ইন্সট্রাক্টর অনেক অ্যাপ্রোচেবল যেকোনো বিষয়ে কথা বলা যায়। কোর্সের কন্টেন্ট অনেক উপকারী। এই কোর্স থেকে যা শিখছি সেটা সরাসরি কাজে লাগাতে পারব বলে আশা করছি।
MM
Md. Mesbah Uddin
ব্যাচ ৫ (গ্র্যাজুয়েট) - সবকিছুই ঠিক ছিলো, ভাইয়ারা অনেক হেল্পফুল, যখন যা কোয়েশ্চন করসি, সবকিছুরই এন্সার দিয়েছেন এবং সেটাগ্রুপে। বুঝাইসে অনেক সুন্দর করে। আমি একটা প্রবলেম ফেস করসিলাম, সাথে সাথে সাপোর্ট টিম আমাকে হেল্প করছিলো। ওস্তাদ পার্ফেক্ট, হান্ড্রেডে হান্ড্রেড।
HR
Habibur Rahman
ব্যাচ ৫ (গ্র্যাজুয়েট) - ওস্তাদের পুরো টিমকেই ধন্যবাদ। ইন্সট্রাক্টরদের ক্লাস থেকে আমি ভরপুর শিখেছি। যে পরিমাণ কোয়েশ্চন আমি করেছি, বলার বাইরে। আর ব্যাচ কোঅর্ডিনেটরকেও অনেক ধন্যবাদ। এত প্রোফেশনাল ওয়েতে সবকিছু হ্যান্ডল করেছেন- বলার বাইরে।
AJ
Arif Jawad
Batch 6 running - The instructors showcased impressive expertise in MS Excel, clearly explaining complex concepts while ensuring the sessions remained engaging and practical. Overall, it was a valuable learning experience.
S
Sadi
Batch 8 running - The instructors are great. I think we'll learn a lot from their classes.
MA
Md Anas Uddin
Batch 15 running - The instructor is knowledgeable and well-prepared for the classes.he encourages students to ask questions and participate in discussions(supportive and helpful).
NE
Noor E Najat Prapti
ব্যাচ ৫ (গ্র্যাজুয়েট) - আমি ওস্তাদ টিমকে ধন্যবাদ জানাচ্ছি। এত সুন্দর একটা আয়োজন করেছেন। আমি রিসেন্ট একটা ড্যাশবোর্ড তৈরি করেছিলাম। স্যারকে আমি সেটা সেন্ড করেছি। সাথে সাথে এত সুন্দর একটা ফিডব্যাক আমি পেয়েছি। আমাদের দেশে এরকম ড্যাটা এনালিটিক্সের কোর্স খুবই কম। বিশেষ করে বাংলা ভাষায়। কারণ এখানে ভাষাটা মেইন ইস্যু। ইউটিউবে অনেক ভিডিও আছে। কিন্তু বাংলায় কম। আর ওস্তাদ প্ল্যাটফর্ম এই জায়গাটা ভালোভাবে কভার করেছে!
BR
Bappi Rumin
ব্যাচ ৪ (গ্র্যাজুয়েট) - কোর্সটি শুধুমাত্র একটি কোর্স না — এটি একেকজনের ক্যারিয়ার শুরুর পথ তৈরি করে দিচ্ছে। আর এই অসাধারণ উদ্যোগের ছোট্ট একটা অংশ হতে পেরে নিজেকে সত্যিই ভাগ্যবান মনে করছি। এই ভিডিওটি শুধু প্রোডাক্ট প্রমোশন না, বরং সেইসব মানুষদের উদ্দেশ্যে একটি বার্তা — 'আপনি যদি Data-Driven Career শুরু করতে চান, তাহলে এখনই সময়'
SH
Shakhawat Hossain
Batch 6 running - The instructor's teaching process is good and understandable.
NA
Naima Ahmed
Batch 8 running - The instructors are great. I think we'll learn a lot from their classes.
MA
Md Anas Uddin
Batch 15 running - Very much co operative, cleary define roadmap which will help me to understand to think the right way how I could apply my the skills in my professional life as well as developed my personal skills.
MA
Mohammad Ali Bakshi
ব্যাচ ৪ (গ্র্যাজুয়েট) - আমাদের যতটুকু মডিউল ছিলো, যারা ইন্সট্রাক্টর ছিলেন- সর্বোচ্চটাই দিয়েছেন।
ফআ
ফোরকান আমিন
ব্যাচ ৪ (গ্র্যাজুয়েট) - আমাদের জার্নিটা অনেক দিনের। আমাদের যারা লার্নার ছিলেন, সবাই অনেক ভালো সাপোর্ট পেয়েছি। আমরা যেটুকু শিখেছি, সেটাকে যদি প্র্যাক্টিস করি, অনেক অনেক ভালো হবে। প্র্যাক্টিস ভালো না করলে ভুলে যাবো। ইন্সট্রাক্টররা অনেক বন্ধুত্বপূর্ণ ছিলেন। সাপোর্ট পেয়েছি হাসিমুখে। পরবর্তীতেও যদি কোন কোর্স আসে, আমি আবার করবো।
ক
কামরুজ্জামান
Batch 7 running - Very supportive, and the instructors were very approachable and always willing to help, no matter how small the question. They made learning so much more comfortable and stress-free.
FM
Farah mahjuba
One the most rigorous course on excel, Power Query and Power BI. Also, a great learning opportunity related to data analysis in general. Job placement support is outstanding. If you stay focused and perform well in the program, many doors will open for you. .
MA
Md. Ahnaf Sadik Inan
Batch 15 running - এক্সেলের বিষয়গুলো অনেক ক্লিয়ারলি বুঝিয়ে দিয়েছেন স্যার। প্র্যাকটিক্যাল এক্সাম্পল দিয়ে শেখানোর কারণে শেখাটা অনেক সহজ হয়ে গেছে।
SN
Shubhashish Nath
সার্টিফিকেট
কোর্স শেষে পেয়ে যান শেয়ারেবল কোর্স কমপ্লিশন এবং এসেসমেন্ট সার্টিফিকেট
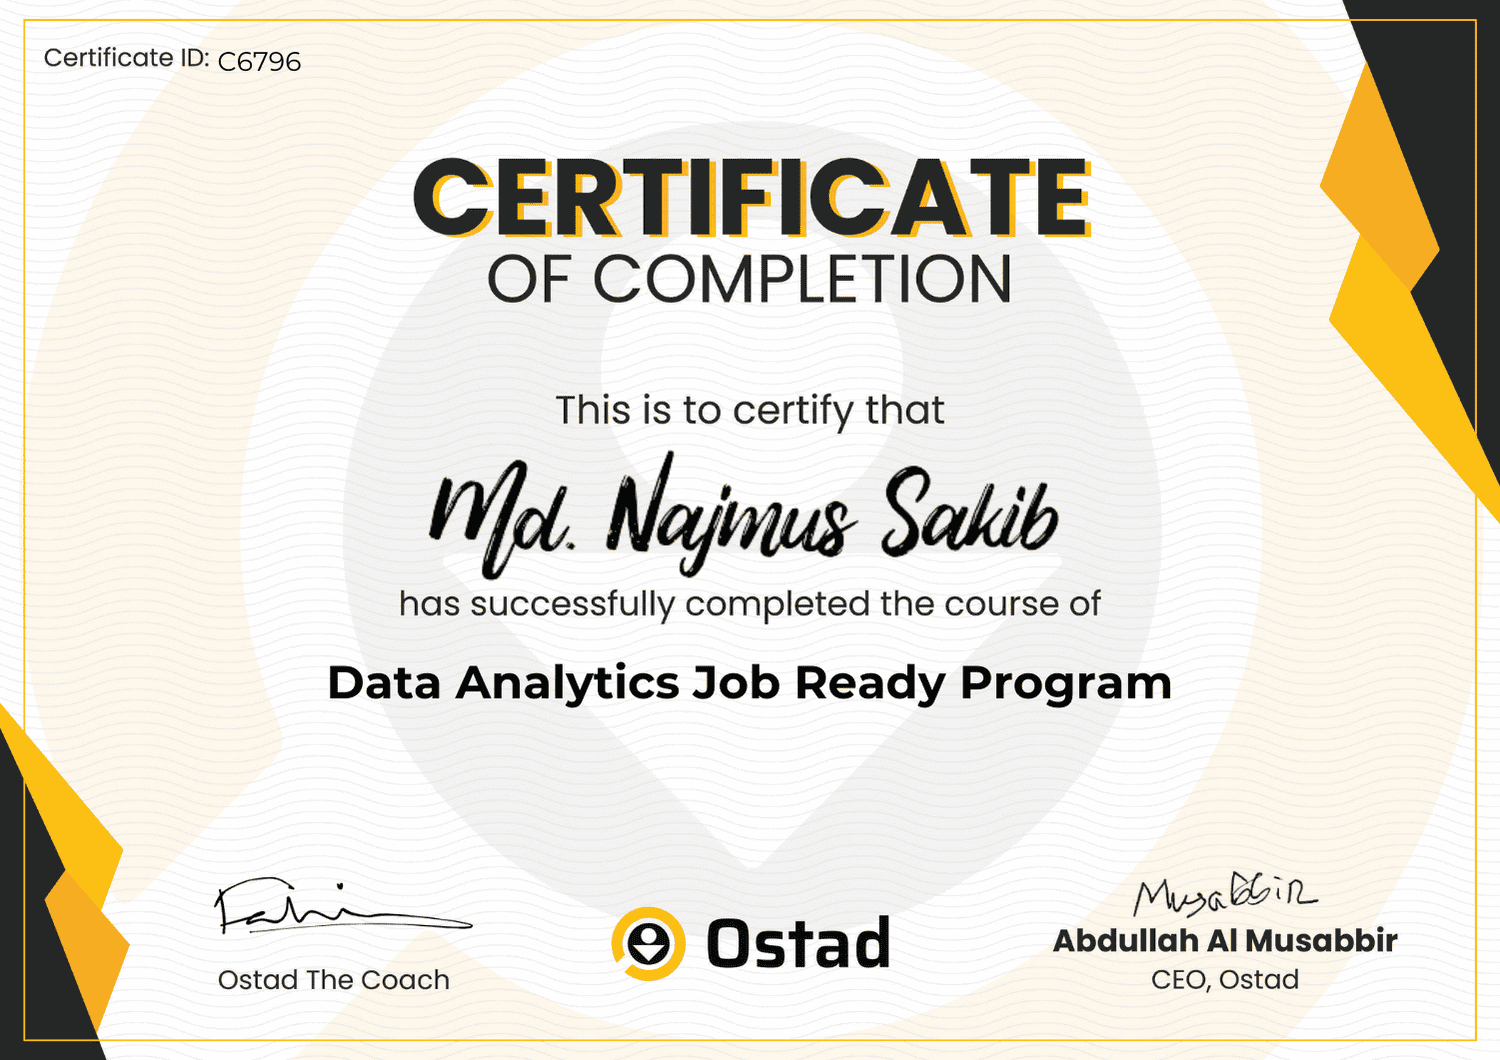
কোর্স কমপ্লিট করে পেয়ে যান শেয়ারেবল কোর্স কমপ্লিশন সার্টিফিকেট
কোর্সে আপনার এসেসমেন্টের রেজাল্টের ওপর পেয়ে যান এসেসমেন্ট সার্টিফিকেট
.jpg)
প্রায়ই জিজ্ঞেস করা প্রশ্ন
How to Pay
1. পেমেন্ট মেথড কি কি?
 আপনি সরাসরি ওস্তাদের পেমেন্ট গেইটওয়ের মাধ্যমে Bkash, Nagad, Rocket, Visa, Mastercard, Debit and Credit কার্ড দিয়ে পেমেন্ট করতে পারবেন।
2. আমি কি যেকোনো ডিভাইস দিয়ে পেমেন্ট করতে পারবো?
জ্বী, আপনি ফোন, পিসি কিংবা ল্যাপটপ যেকোনো ডিভাইস দিয়ে পেমেন্ট করতে পারবেন।3. পেমেন্ট প্রসেস কি?
পেমেন্ট করার জন্য প্রথমে ব্যাচে ভর্তি হোন বাটনে ক্লিক করুন। এরপর পেমেন্ট পেইজ থেকে পেমেন্ট মেথড সিলেক্ট করে পেমেন্ট করুন বাটনে ক্লিক করুন এবং পেমেন্ট সম্পন্ন করুন।4. ডিসকাউন্ট কিভাবে পাবো?
আপনি ব্যাচে ভর্তি হওয়ার আগে এভেইলেবল প্রোমো কোড বসিয়ে এক্সপেক্টেড ডিসকাউন্ট পেতে পারেন।5. পেমেন্ট কনফার্মেশন কিভাবে পাবো?
পেমেন্ট প্রসেস শেষ হলে আপনার কাছে একটি মেসেজ আসবে এবং আপনার ড্যাশবোর্ডে আপনার জয়েন করা ব্যাচটি দেখাবে। আপনার স্টাডি প্লান অনুযায়ী কোর্স শুরু করে দিতে পারবেন।6. আমার লেনদেনের হিসাব থাকবে কি?
আপনার ড্যাশবোর্ডে আপনি প্রোফাইল থেকে ট্রাঞ্জেকশন ট্যাবে ক্লিক করে লেনদেন দেখতে পারবেন।
Join our Facebook group

3900 Members
Data Analytics Community
Talk to Career Counselor

*সকাল ১০ টা থেকে রাত ১০টা পর্যন্ত
Promo Code GOAL 37% Discount, 8 Days Left!